A LoRa‑Enabled IMU Study
Analyzing hand movement patterns during well and sick periods.
Introduction
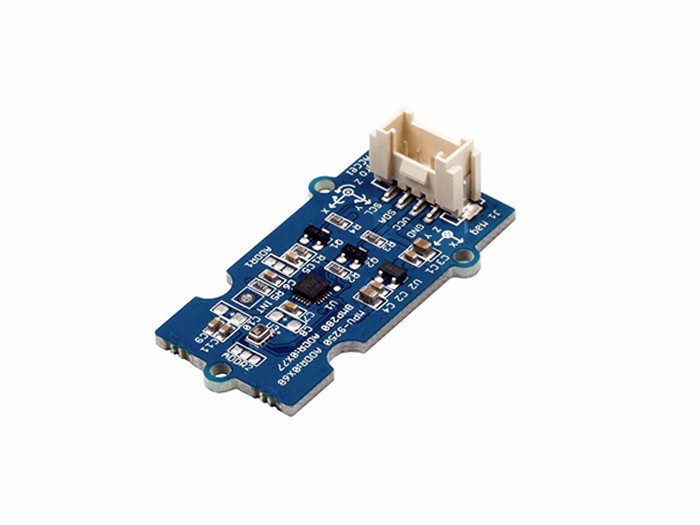
Monitoring human movement can reveal subtle changes in health. In this study, I recorded hand motions during two distinct periods–normal wellness and a three-day illness–using a Grove IMU 10DOF v2.0 sensor.

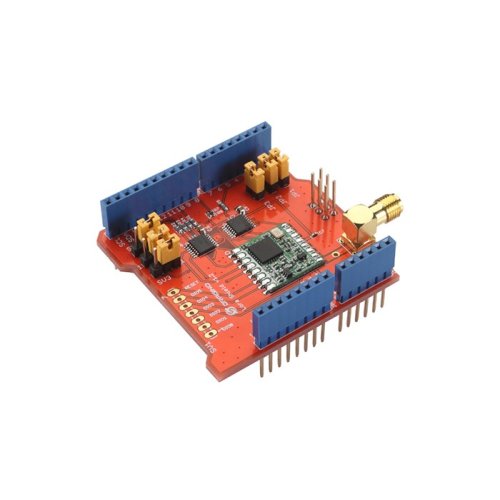
Data were wirelessly transmitted over LoRa shields attached to Arduino Uno boards, logged to CSV, and visualized in real time and replay mode using a custom desktop application.
Materials and Methods
- Hardware: Two Arduino Uno boards, two LoRa shields, Grove IMU 10DOF v2.0.
- Data Transmission: Sensor readings (accelerometer, gyroscope, magnetometer, temperature, pressure, altitude) were packaged and sent via LoRa at regular intervals (~200 ms).
- Logging: Incoming packets were appended to timestamped CSV files for later analysis.
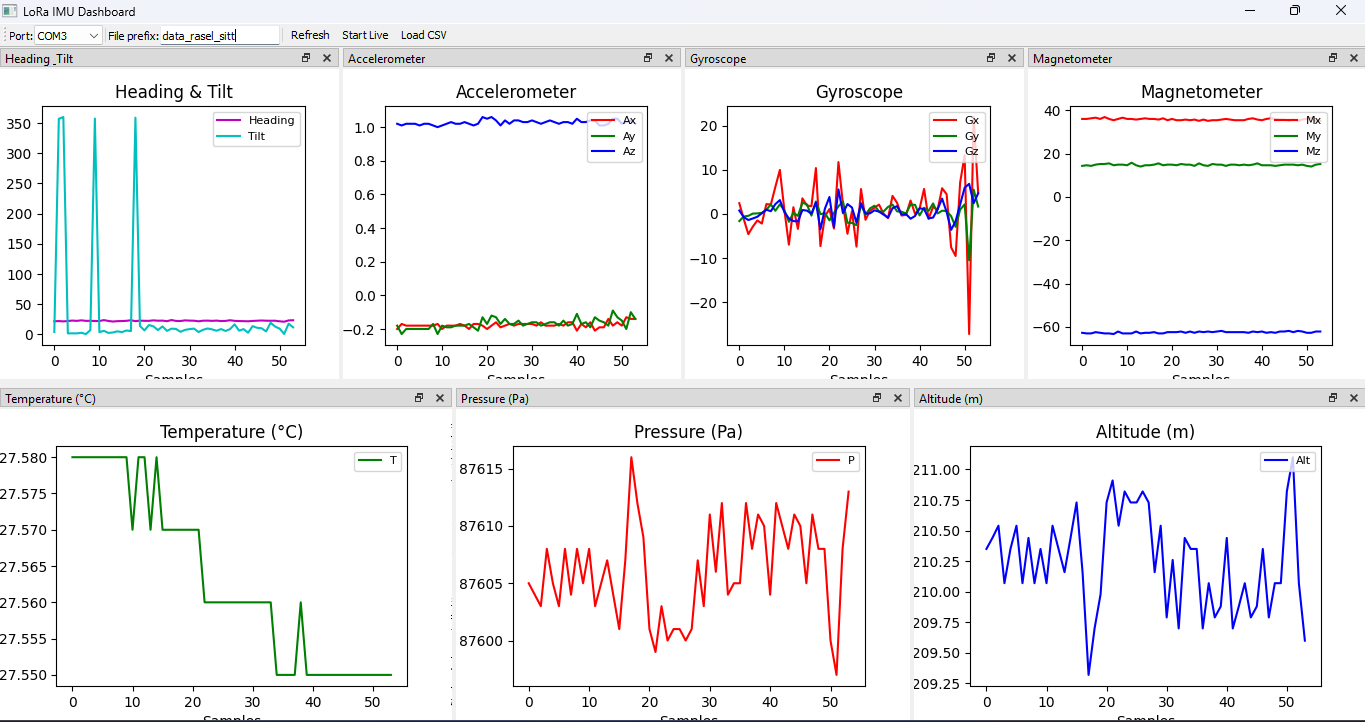
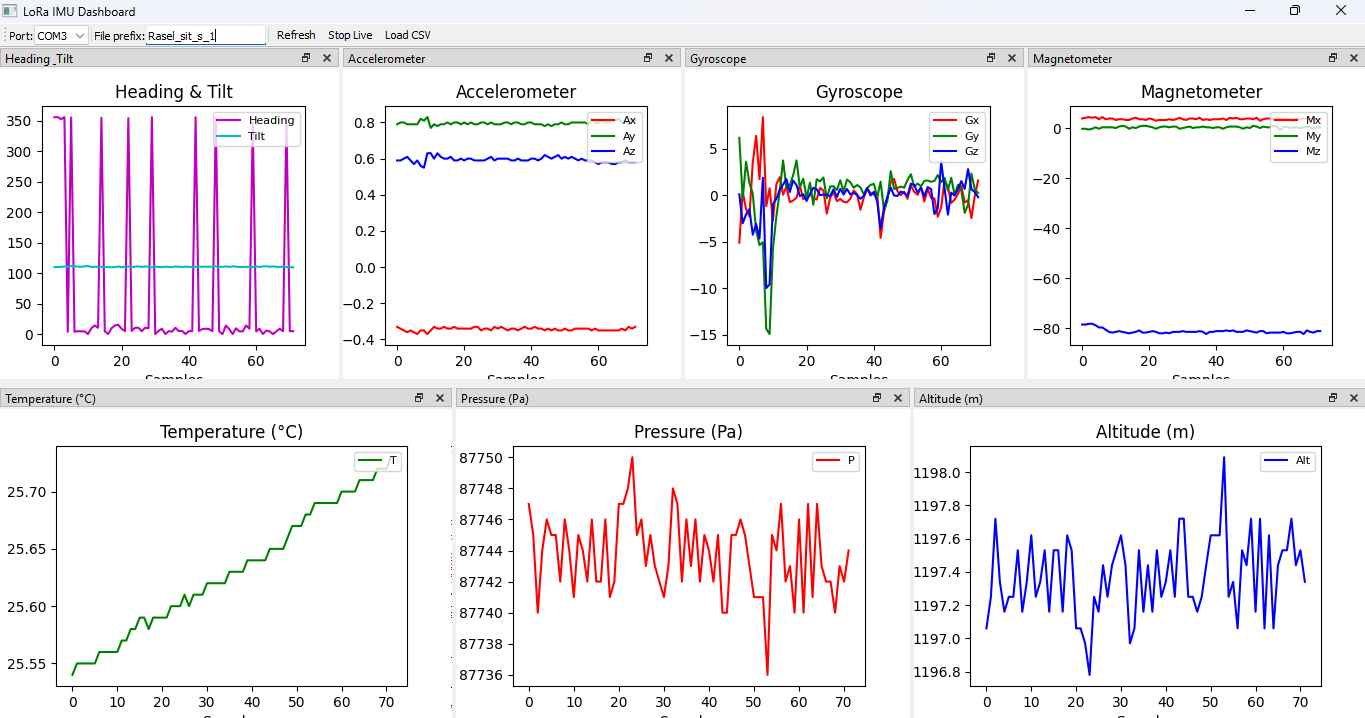
- Visualization App: A Python‑based desktop GUI displays live streams of all IMU channels, and can load saved CSVs for replay. Screenshots illustrate the dashboard layout.

Experiment Setup
- Attached the IMU sensor to the back of the right hand.
- Configured one Arduino as transmitter, the other as receiver.
- Live capture: clicked Start Live, then moved the hand through common gestures (tilt, rotation, lift).
- Saved data by clicking Stop Live to replay for later.
- Repeated the process during a period of illness (started two days before capture) to compare patterns.
Desktop Dashboard Overview
The dashboard is divided into panels for each sensor channel:
- Heading & Tilt: Heading and tilt angles over time.
- Accelerometer (Ax, Ay, Az): Linear acceleration components.
- Gyroscope (Gx, Gy, Gz): Angular velocities.
- Magnetometer (Mx, My, Mz): Magnetic field axes.
- Temperature, Pressure, Altitude: Environmental readings.


Results
- Movement Amplitude: During illness, peak tilt angles decreased compared to the healthy baseline.
- Gyro Variability: Standard deviation of Gx increased when sick, indicating more unsteady motion.
- Recovery Over Time: In replay mode, early frames (ill period) show flatter acceleration curves.
Data (CSV Snippet)
timestamp,Ax,Ay,Az,Gx,Gy,Gz,Mx,My,Mz,H_heading,H_tilt,T,P,Alt,Atm
2025-05-17 18:28:30.721638,-0.2,-0.18,1.02,2.43,-1.63,0.76,36.04,14.36,-62.7,21.72,4.0,27.58,87605.0,1210.35,0.8646
2025-05-17 18:28:30.977477,-0.17,-0.23,1.01,-1.23,-0.59,-0.74,36.04,14.65,-62.99,22.12,357.01,27.58,87604.0,1210.44,0.8646
.............
Discussion
The full‑range IMU data show measurable differences in hand motion smoothness and range between healthy and sick states. Reduced tilt amplitude may stem from fatigue, while increased gyro noise suggests less controlled gestures. Further studies could correlate these metrics with symptom severity. (will continue from here (experiment)).
Conclusion
This work demonstrates a LoRa‑based system for remote human activity recognition. The real‑time dashboard and replay feature simplify pattern discovery, and early results show clear distinctions between normal and sick motion profiles.
References
- LoRaWAN Gateway, Dragino.
- Grove IMU-10DOF v2.0 Datasheet, Seeed Studio.
- Semtech LoRa Technology, Semtech White Paper.